The following are 3 small experiments on Data Driven Drawings for the web.
A line with D3.js and SVG
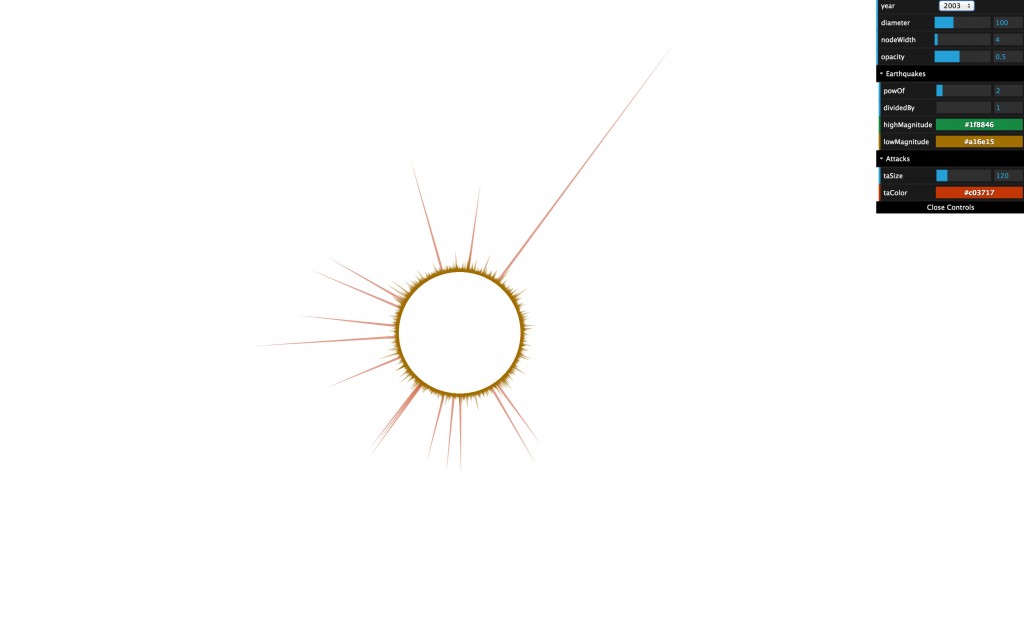
I am using the d3 library and its easiness to visualize any kind of data to have the first look at my material. In this case, earthquake data from colombia gathered from Ingeominas and terrorist attacks data from the Centro Nacional de Memoria Histórica.
At this point of my experimentation I am more interested in the aesthetic representation of the data over trying to explain it or reveal the narratives that it beholds. Yet, as this first images start to appear and I tweak the math and code that construct them, certain qualities such as the way in which the data pulsates over time, the textures, scales, gaps, etc, become the source of “abstract” information that I want to translate into drawing and animation. This process takes me back to that of interpreting music for animation – visual music – in the sense that one is guided by the emotions and abstract information provoked by the music to inform the images that dance along.
A pencil line with data
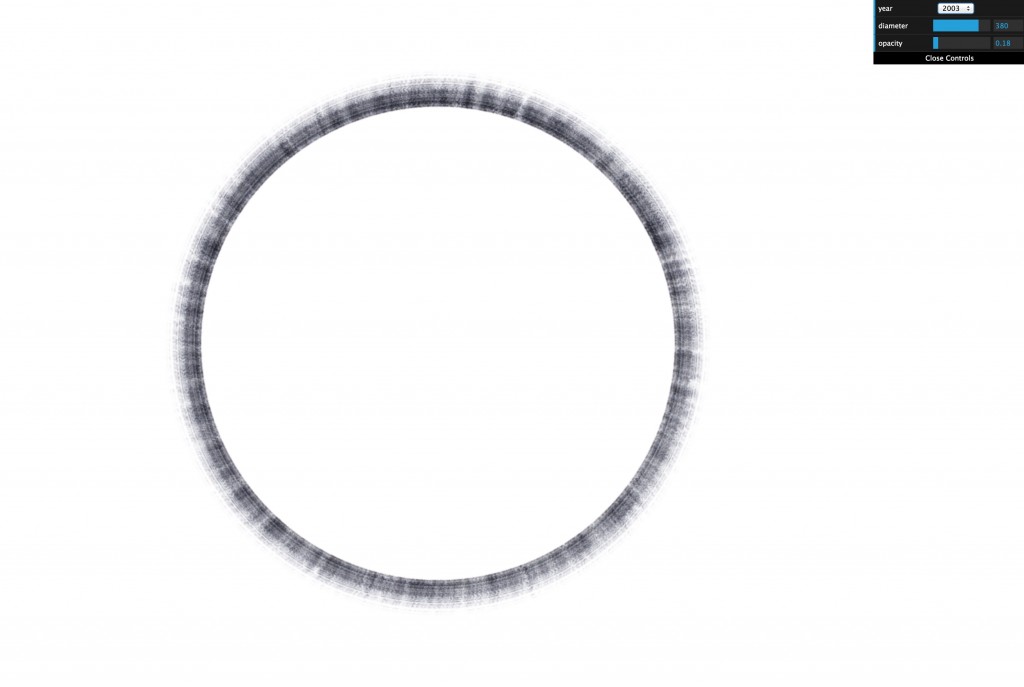
After looking at the data I moved into one of the main ideas I am after in my research which is to bring hand drawn images into the representation of data. What I did here was that I drew on a piece of paper a few strokes with a pencil.  The first line represents earthquakes below magnitude 2, the second between 2 and 4 and so on. What happens then is that by using very similar code as for the SVG visualization above, a line is drawn dynamically on screen based on the data. Whenever there is a lot of seismic activity, the stroke becomes darker just due to the additive nature of how this line is being drawn on the screen.
This very simple experiment is very important to my process because finally, after a long time coding and dealing with technical development, the hand drawn images start to appear and the project comes closer home. It feels as if the pieces are starting to fall in place and now I will be exhausting the possibilities of the tools I’ve spend some time developing and learning how to use.
Extended pencil line
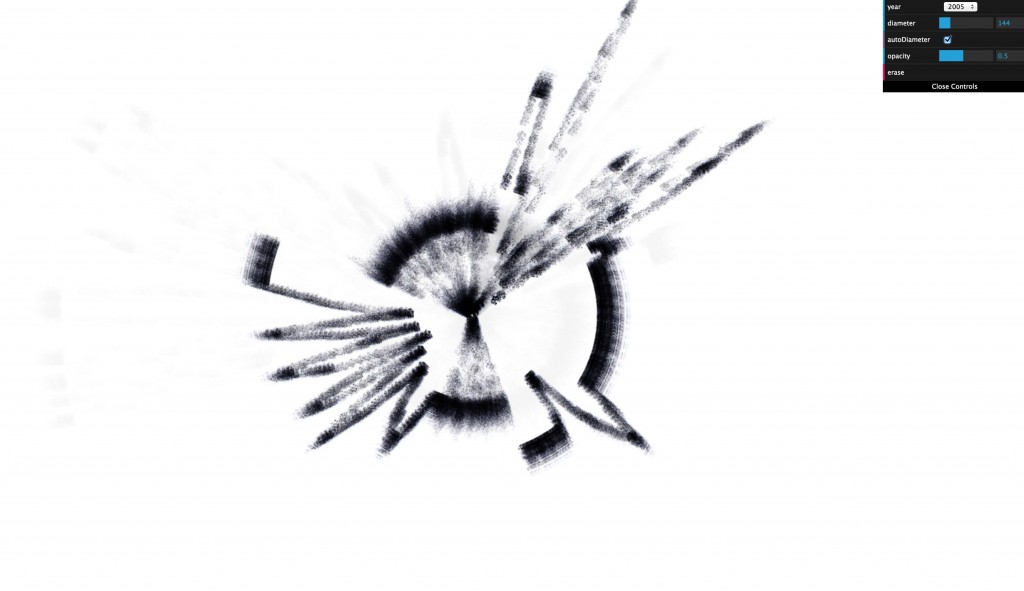
Now that the code is working, I started making some changes and created this dynamic version of the experiment above. This has provided a lot of information as to how to produce the animation and sprites. In this case the difference between the pencil lines is too discreet and I want to see what happens when I make looser strokes, detach myself from 1 to 1 ways of representing the data and overall just have with with it. I’ll keep posting links to the experiments as I make them.
Leave a Reply